Real Estate:
Funny Story:
About All That AI Money
If you know of anyone thinking about buying, selling, or investing in real estate - anywhere in the world - I appreciate your referrals. With Gratitude, Marissa P.S. Follow me on Instagram; at least you'll laugh.
| |
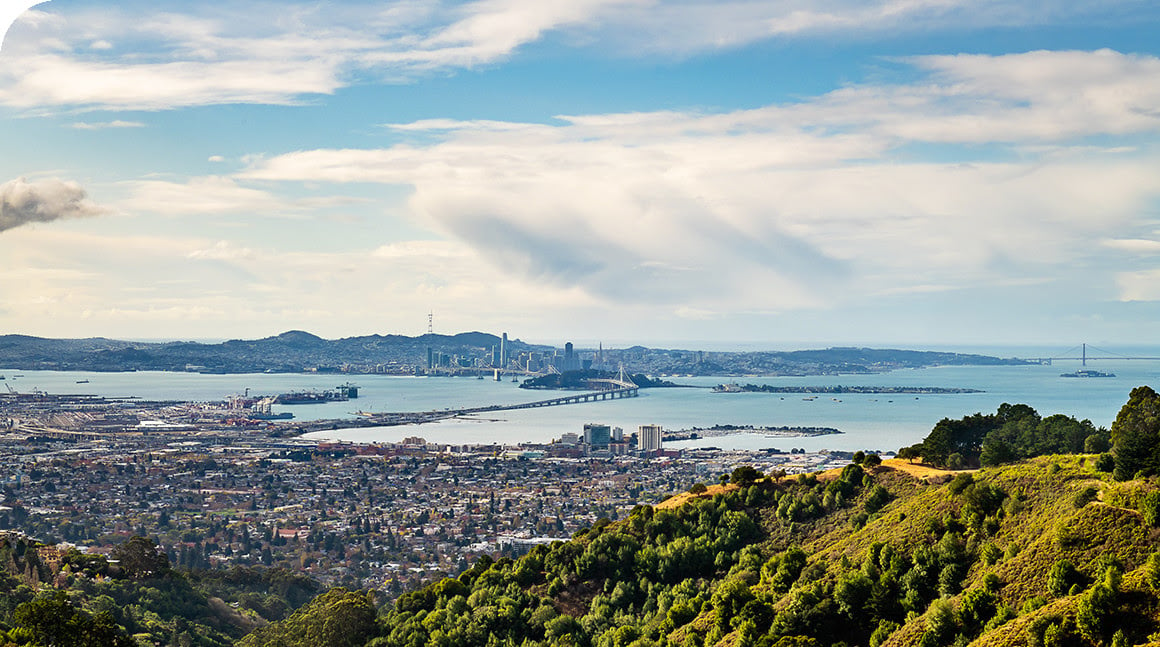
WHAT THE AI IPO WAVE COULD MEAN FOR INNER EAST BAY HOME VALUES Ask an East Bay homeowner what an OpenAI or Anthropic listing means for their property and you'll hear either "nothing" or "everything." The research supports something more precise — and it points closer to home than you might think. What Berkeley FoundA UC Berkeley honors thesis by Mina Nezam-Mafi, advised by economist Enrico Moretti, analyzed 711 Bay Area emerging-growth IPOs between 1996 and 2015. Offer size moved home values not only within the company's own ZIP code but at 5, 10, and 20 miles out — with the effect weakening as firm-home distance grew, and registering in both the short and long term. Call it distance decay. Here's what that means for the Inner East Bay: Rockridge, Piedmont, Berkeley, Albany, Alameda, and El Cerrito sit roughly 8 to 14 miles from SOMA — squarely inside the measured bands, not at their edge. The one asterisk is the water. A companion UCLA/Penn State study treated the Bay itself as a commuting barrier, and straight-line miles across it aren't quite commuting miles. But BART changes that math: the Inner East Bay functions as San Francisco's commute shed in a way no other corridor east of the hills does. Timing matters as much as geography. That UCLA/Penn State study of California IPOs from 1993-2017 found price indexes within 10 miles of headquarters rose about 1.0% after public filing and 0.8% after issuing — with post-lockup effects depending on how the stock performed afterward. The effects are front-loaded: expected wealth moves housing demand before liquidity arrives. Sellers waiting for lockup expirations are waiting for a wave that has mostly already landed. The Evidence Shows Up in Cash, Not PriceThe scale is real. Anthropic and OpenAI offerings could mint roughly 7,600 new millionaires concentrated in San Francisco, per private-market analysts — on top of the 4,400 from SpaceX's June listing, most of those in Southern California. Anthropic has filed confidentially, with bankers pointing to a fall listing; OpenAI may slip to 2027. July reporting on the "wealth tsunami" profiled a midlevel Anthropic technical staffer whose equity had inflated past $72 million. But watch the mechanism. Bay Area luxury buyers put down a median 35% in 2025, up from 28.4% before rates surged in 2023 — nearly $200,000 more cash at closing on a $3 million home, even as borrowing costs declined. This wealth arrives as leverage in competitive situations, not as broad inflation. That distinction explains the split screen. Red Oak's local data has San Francisco up 22% in Q2 year-over-year while Santa Clara County slipped about 2%; the AI boom has pulled the region's center of gravity north — and the Inner East Bay sits directly in its path. The Spillover BuyersHere's the quieter story. As San Francisco's single-family inventory has thinned to a few hundred active listings and its premium neighborhoods trade at eye-watering per-square-foot prices, buyers priced out of the city — not IPO winners, but the strong-income households competing against them — are looking across the Bay rather than down the Peninsula. They land predictably, in the neighborhoods that most resemble what they left: character-rich, BART-adjacent and sidewalk lined for single-family homes in the Oakland/Berkeley core. That overbid floor is the mechanism made visible: intentional underpricing meeting cash-heavy competition.
Source: Bridge MLS, Red Oak Realty Q2 Report
What Sellers Should Take From ThisThree things. Single-family homes in established, side-walk friendly, BART-served neighborhoods are absorbing this demand; condos are not. Presentation and pricing discipline still govern outcomes — buyers holding an extra $200,000 in cash are not buying deferred maintenance. And the correlation, while real, is modest: San Francisco Fed research on the dot-com era found a 10% rise in local tech valuations lifted Bay Area home prices 1% to 2% over the following two years. Not a tidal wave. A tide. If you would like to receive a copy of Red Oak Realty's Q2 Data Report, reach out! Sources: Bridge MLS, Nezam-Mafi, "Micro-Level Impact of Initial Public Offerings on Bay Area Housing Inflation," UC Berkeley senior honors thesis, 2021; Hartman-Glaser, Thibodeau & Yoshida, "Cash to Spend: IPO Wealth and House Prices," Real Estate Economics, 2023; Federal Reserve Bank of San Francisco Economic Letter, "Tech Stocks and House Prices in California," 2000. |